Having lived in Denmark, a country that consistently ranks in the top 5 of World Happiness Index, I was curious to understand what makes a place happy. The World Happiness Report first released in 2012 and ranks countries based on life evaluations from samples of each countries' population.
This map visualises the happiness scores of different countries in the 2021 Happiness Index:
An obvious answer is that wealthier countries will be happier because citizens enjoy higher incomes and have access to better resources and infrastructure. I regressed happiness against log GDP per capita, using python .
The dataset used (from the World Happiness Report) has observations beginning in 2008, meaning 1000s of observations were used to make the regression. The OLS estimator was: Happiness=-1.69+0.765(Log GDP per capita). The coefficient suggests a 1% increase in GDP per capita would lead to a 0.765% increase in happiness rating. However, results are likely to be biased due to endogeneity issues so it is more useful to analyse the correlation.
This graph shows the correlation between Log GDP per capita and Happiness rating, using data from 2008-2020:
We can see positive correlation between GDP and happiness, with a R2 of 0.62.
The report bases life evaluations on 6 factors: levels of GDP, life expectancy, generosity, social support, freedom and corruption. Participants are asked the extent to which each factor is estimated to contribute to making life evaluations higher in their country compared to Dystopia, a hypothetical country that has values equal to the world’s lowest national averages for each of the six factors.
GDP per capita makes up the biggest identifiable contribution to happiness, but we can see that a large part of happiness is left unexplained by the six factors used by the World Happiness Report.
The World Happiness Report acknowledges that there are other factors that affect happiness that are not yet included in the report. They also highlight that the variables are intended to illustrate correlation rather than to reflect clean causal estimates.
I decided to look for evidence of correlation between happiness and other factors excluded in the report. This could help explain the large unexplained "residual" contribution to countries' happiness.
Firstly, I looked at gender equality and happiness. I used data scraped from the UNDP Global Inequality Index ( python) to look for correlation between Gender inequality and happiness:
The graph suggests a negative correlation between gender inequality and happiness. I used 2019 data because this was the most recent Gender Inequality Index data that I could find.
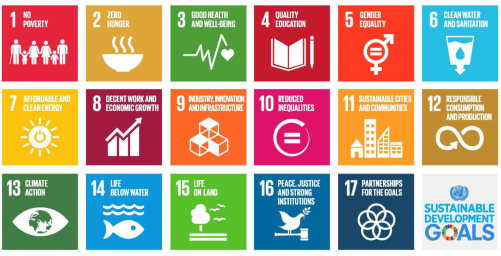
The writers of the World Happiness Report published a paper comparing happiness ratings with countries Sustainable Development Goal scores. The Sustainable Development Goals were adopted by all UN countries. Countries are rated for each goal out of 100. There are 17 Goals:

The research found the strongest correlations between happiness scores and Goal 9 and Goal 12. I downloaded the data to show these correlations graphically. The SDG dataset was enormous so I used both excel and python to clean the data. I used python to combine the SDG scores with the happiness data and run regressions. My python workbook is here .
I looked for the correlation between Happiness and Goal 9- Industry, Innovation and Infrastructure:
As expected, there appears to be strong positive correlation. I ran an OLS Regression on Python and found the R^2 value to be 0.617.
Next, I looked at the correlation between Happiness and Goal 12- responsible consumption and production. The result is surprising:
The graph suggests a negative correlation between the 2. The R^2 was 0.538.
So, why are some countries happier than others? GDP plays a significant role, and the other 5 factors considered by the World Happiness Report explain some of the variation. We are still left with a significant unexplained residual. I found that gender inequality, industry, innovation, infrastructure, responsible consumption and production are correlated with happiness, explaining some of the shortfall. Further research could identify the causal effects of these variables on happiness.
Data: All the data used is uploaded to my GitHub repository. The excel files downloaded from the World Happiness Report and the Sustainable Development Goals can be found here .
- I was unable to do the cleaning for the SDG data on python – I had to do some cleaning on excel first and then upload this smaller file to python
- There were often missing values in datasets. I used Python to clean datasets before running regressions and making correlation graphs
- For some variables that I wanted to compare with happiness there were not enough data points to show correlations
- I could only find correlations - it would be very difficult to find causal estimates due to endogeneity